Analysis
- Home
- Analysis
Quote comparison
The Quote Comparison is a valuable tool that allows traders to compare real-time bid and ask prices across multiple forex pairs, commodities, or indices. It provides an at-a-glance view of market prices, helping users quickly identify the best trading opportunities by analyzing price disparities and market spreads. This widget is particularly beneficial for traders who want to make fast, informed decisions in a highly dynamic trading environment.
Market News
The News Widget on ACI platform is an essential tool designed to keep traders and investors up-to-date with the latest market-moving news and developments. This widget aggregates real-time news from various reputable sources and displays it in an easily digestible format, making it a valuable resource for market analysis and decision-making.
Forex liquidity
The Forex Liquidity on ACI platform is a key tool that provides traders with real-time information about the liquidity levels in various forex pairs. Liquidity refers to the ease with which a currency pair can be bought or sold without causing significant price fluctuations. This widget helps traders understand the market depth and assess whether a currency pair is highly liquid or experiencing low trading activity.
News Widget
The News Widget on ACI platform is an essential tool designed to keep traders and investors up-to-date with the latest market-moving news and developments. This widget aggregates real-time news from various reputable sources and displays it in an easily digestible format, making it a valuable resource for market analysis and decision-making.
Forex Correlation
The Forex Correlation helps traders understand how currency pairs behave in relation to one another, which can be crucial for making informed decisions about trades. For example, when two currency pairs are positively correlated, it suggests that both will likely move in the same direction. This information is useful for traders as it helps them avoid placing redundant trades in highly correlated pairs, which could increase exposure to the same market risk. Conversely, when pairs are negatively correlated, traders can hedge positions by taking opposite positions in the pairs, potentially offsetting risk in one position with a gain in the other.
Spread comparison
The Spread Comparison tool is essential for traders looking to analyze spread fluctuations across various timeframes. It provides valuable insights into how spreads behave under different market conditions. For instance, during periods of high volatility, spreads may widen due to reduced liquidity, while in stable markets, they tend to tighten. By using this widget, traders gain a clearer understanding of market dynamics, enabling them to make more informed and cost-efficient trading decisions. The ACI Group offers cutting-edge solutions like the Spread Comparison tool, empowering traders with real-time data to optimize their strategies and enhance profitability. Stay ahead in the trading game with the ACI Group’s innovative tools designed to navigate market complexities effortlessly.
Forex Volatility
Discover real-time Forex volatility data across various currency pairs with insights from ACI Group. This tool highlights which pairs are experiencing high or low price movements, helping traders make informed decisions. High Forex volatility indicates significant price swings, offering lucrative opportunities for those who excel in fast-paced markets, albeit with increased risk. On the other hand, low volatility reflects more stable price trends, ideal for traders seeking a controlled trading environment. Stay ahead in the Forex market with ACI Group's expertise in navigating volatility and enhancing your trading strategy.
Forex Heat Map
The Forex Heat Map by ACI Group delivers a powerful, real-time overview of currency strength and weakness across major forex pairs. This dynamic tool provides traders with an intuitive way to evaluate market conditions. Featuring a visually engaging grid, the heat map showcases currencies in relation to one another. Each cell is color-coded to represent the performance of one currency against another, highlighting degrees of strength, weakness, or stability at a glance. Whether you're a beginner or an experienced trader, the ACI Group Forex Heat Map ensures you stay ahead with accurate and actionable insights to navigate the forex market efficiently.
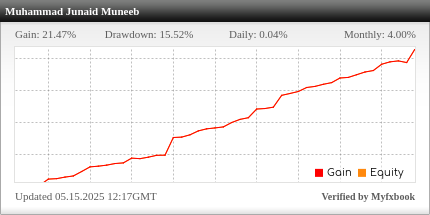
Forex Account's Gain, Drawdown
Track key performance indicators with ACI Group's Account Metrics, offering insights into account gain, drawdown, and more.
Account Gain measures the percentage increase in your account's equity over time, providing traders with a clear view of strategy performance. Whether you're tracking daily, weekly, or monthly gains, this metric helps evaluate success and adjust trading approaches accordingly.
Drawdown is an essential risk metric that tracks the peak-to-trough decline in equity, revealing your exposure to risk. It enables traders to gauge how much capital is at risk during unfavorable market conditions, helping manage risk more effectively.
Optimize your trading decisions with ACI Group's powerful Account Metrics.
Volume Comparison
The Volume Comparison is a dynamic tool designed to provide insights into trading activity across different forex pairs, commodities, or indices. This widget highlights the volume of trades executed in real-time or over specific timeframes, allowing traders to gauge market participation and activity levels. By visualizing volume data, users can identify trends, assess market strength, and make more informed trading decisions.
FAQ
How can we deposite money to ABCFx for investment?
Help You to Find

-
What is the Minimum and Maximum Withdrawal Limit?
The minimum withdrawal is US$ 200 for all accounts and the maximum withdrawal is unlimited.
-
What is the Minimum and Maximum deposite required for opening an account?
The minimum deposite amount is US $2,000 and there is no limit for maximum investment.
-
What are the methods to Deposite and Withdrawal funds?
-
What is the procedure to Deposite funds?
-
Is there any charges for account opening?
No we do not charge any additional fees for account opening.
